
#VC19DublinCase: Cycling Trends in Dublin City
10 May, 2019
Author: Dublin City Council
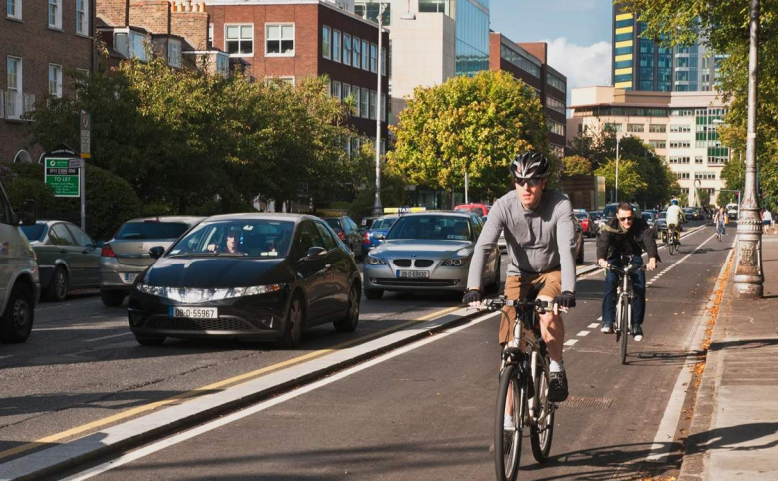
Cycling into Dublin City
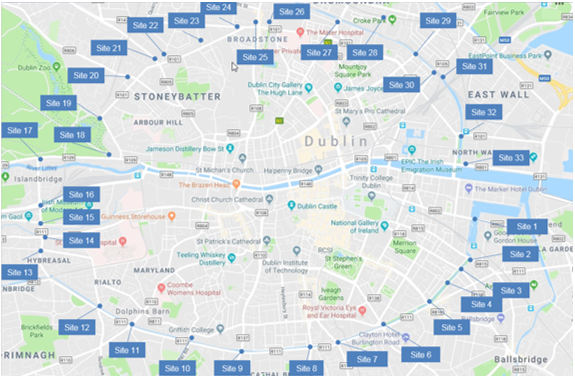
 Every November, traffic counts take place at 33 locations at what is known as the Canal Cordon in Dublin which collects data on the number of people travelling into Dublin by various modes including walking, cycling, private car, bus, taxi, motorcycle, light and heavy goods vehicles.
This is supplemented by surveys undertaken by Dublin Bus, Iarnród Éireann and Transport Infrastructure Ireland (TII) to obtain passenger numbers on the different public transport services. The location of the counts follows the Grand Canal to the south and part of the Royal Canal to the north of the city.
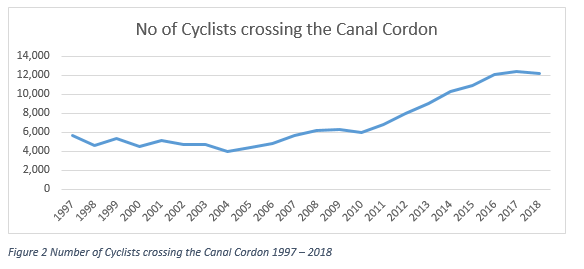
Between 1997 and 2018 the number of cyclists crossing this cordon heading into the city centre between 7 am and 10am increased by 117% from 5,628 to 12,227. Cycle numbers remained between 4,000 and 6,000 between 1997 and 2010 before increasing by approximately 15% year on year until 2015 when the increase slowed up until 2017 and had a small decrease in 2018 (Figure 2).
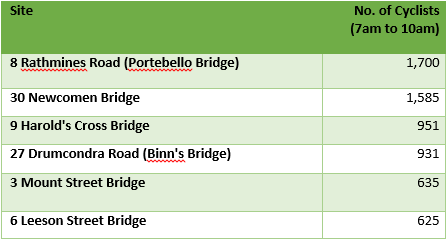
Whilst there are 33 sites where cyclists can cross into the cordon area just 6 sites account for slightly over half (53%) of all cyclists entering the city area with the other 27 sites accounting for the remaining 47% (Figure 3).
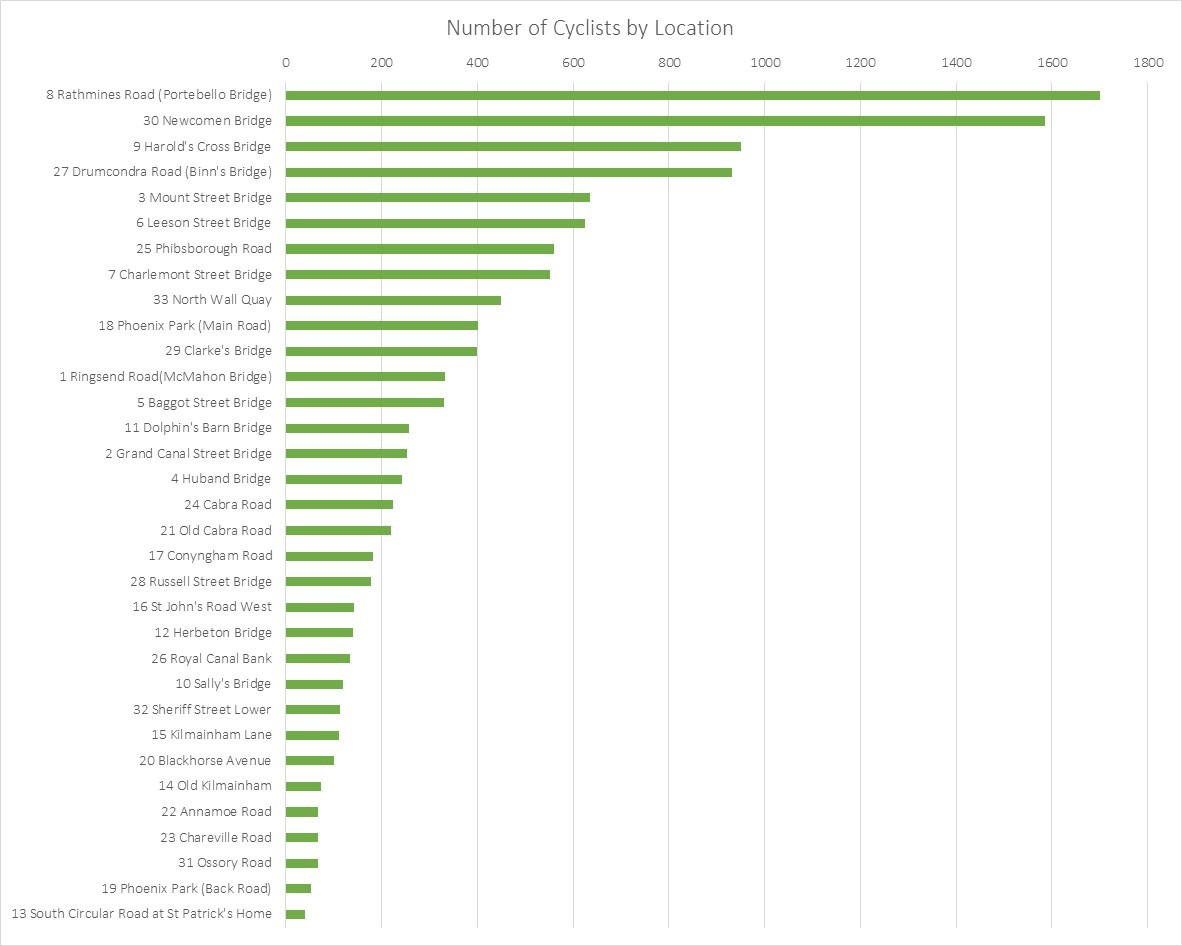
The six most used sites are:
While the six lowest used sites are:
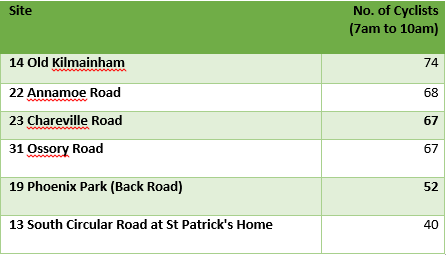
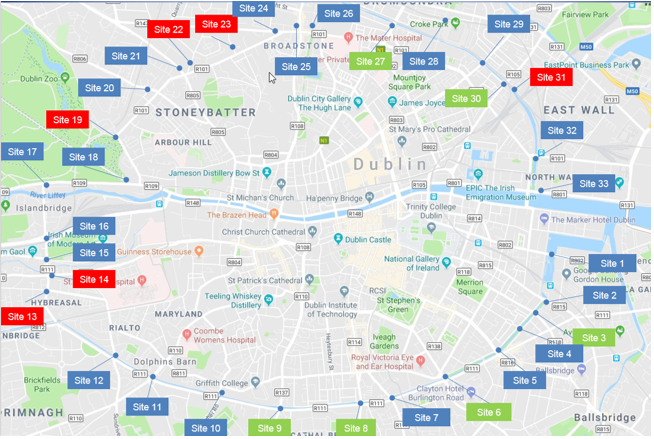
This shows there is a big variation in the number of cyclist entry points to the city. Four of the top six sites are on the south side and two on the north side with all six on the eastern side of the city (sites coloured green in Figure 4). The six sites with the lowest numbers (sites coloured red in Figure 4) are mainly to the west and one in the northeast. The cycle facilities vary between the most and least used locations. The most used locations have a Shared Bus/Cycle lane or an advisory cycle lane on the immediate approach to the entry points and on the main route leading to those points. The majority of the lowest used however have no cycle facilities on the immediate approach or on the routes leading to those points.
Cycling within Dublin City
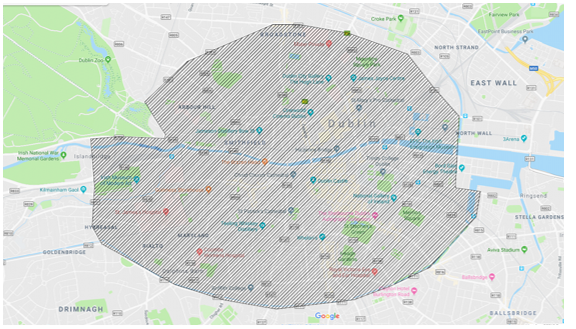
The canal cordon counts track the number of cyclists entering the city. However, within the cordon area (Figure 5) there are also 7,668 people living within city area who commute by bike, approximately 10% of commuters (within this area 39% of people walk to work), according to JCDecaux. The number commuting by bike within this area has increased by 54% between Census 2011 (which was during the economic downturn) and Census 2016.
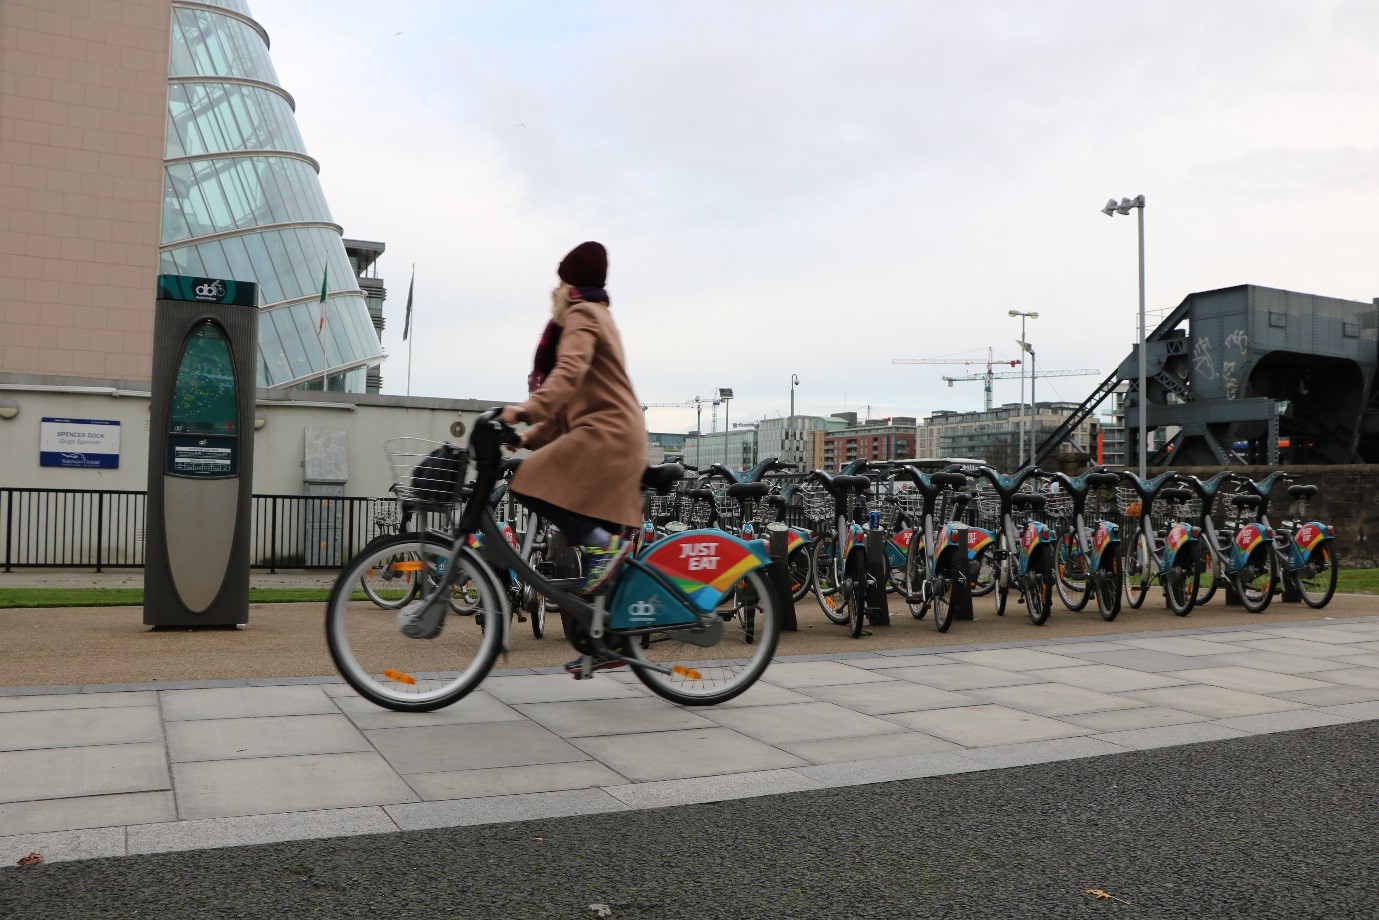
There is also a bike sharing scheme within Dublin (Just Eat Dublin Bikes) which operates within the city area, mainly within the Cordon area. Between 7am and 10am there are approximately 4,000 journeys made using these bikes.
For more information on the Velo-city Programme, Exhibition and Registration go to: https://www.velo-city2019.com
Sign up for our newsletter: https://abbey.us9.list-manage.com/subscribe?u=fd5fa9b846888ef25e85f1973&id=75273fab2e
Follow us on social media: Facebook, Twitter, Instagram, LinkedIn
Regions:
News category:
Network/Project Involved:
Related content

ECF at COP29 | Baku, Azerbaijan | 11-22 November 2024
ECF will actively participate once again at COP29 as a UN-accredited observer NGO, as well as a core partner of the Partnership for Active Travel and Health (PATH), and a long-time member of the Partnership for Sustainable Low Carbon Transport (...
Froso Christofides
14 Nov, 2024

ECF at the World Urban Forum 12 | 4-8 November | Cairo, Egypt
Authored by Jill Warren and Froso Christofides ECF goes to WUF12 to advocate for cycling’s potential to help meet climate goals and improve people’s health and lives The twelfth session of the World Urban Forum by UN-Habitat took place on 4-8...
Jill Warren
12 Nov, 2024

Neringa Municipality – Merging Natural Beauty, World Heritage and Cycling Ambition
ECF welcomes Neringa Municipality to Cities & Regions for Cyclists, a network that brings together local and regional administrations committed to promoting cycling as a mode of transport and leisure, collectively representing...
Froso Christofides
12 Nov, 2024
Contact the author

Recent news!


Upcoming events
Contact Us
Avenue des Arts, 7-8
Postal address: Rue de la Charité, 22
1210 Brussels, Belgium
Phone: +32 2 329 03 80
Email: office@ecf.com