Integrating cyclists’ behaviour in modelling and assessing the benefits
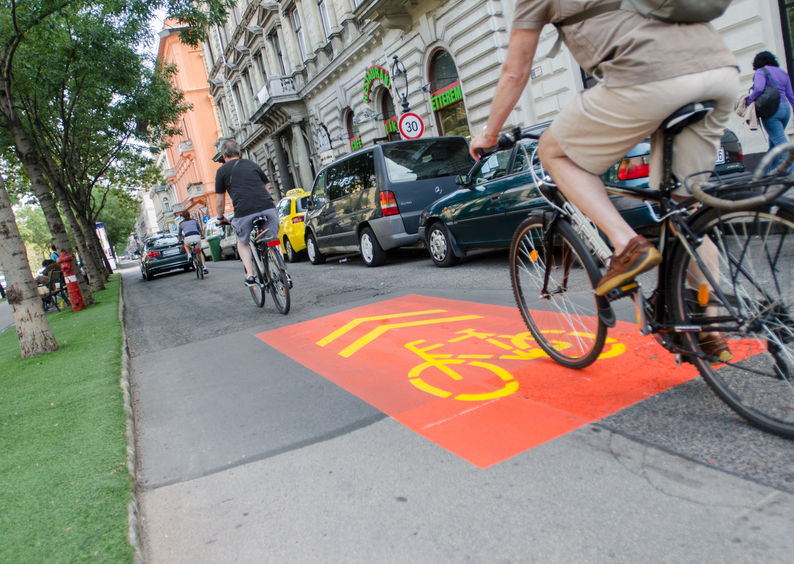
Most people are probably more interested in models on bicycles than in modelling cyclists. Nevertheless, modelling cyclists is a challenging issue in the FLOW project. How to predict bicycle traffic after implementing a traffic measure? How can you justify the investment in a bicycle bridge? Will a certain intersection still work with more cyclists? The partners in the FLOW project discussed how to include cyclists and pedestrians in traffic models in a workshop with the twelve consultancies from different European countries, which were selected as ‘forerunners’.
Tools and models
In the FLOW project assessment tools are designed to evaluate the impact of a particular measure for pedestrians or cyclists. In the first place FLOW has developed a methodology to analyse congestion. What is new in this methodology is that it does not only counts the delay in car traffic, but of all the traffic participants, including cyclists and pedestrians.
However, more or less congestion is not the only effect of an infrastructure measure. A higher traffic safety, less noise and emissions, health benefits of active cycling and walking, less energy consumption, less land use for parking cars, increasing rents of attractive shops and houses: this is just a limited list of indicators taken into account in the FLOW ’impact assessment tool’. This new tool can count the wider impact of cycling measures such as building a cycle bridge or a new cycle path. It will give decision makers a useful tool that compares the costs and the benefits of an investment for walking and cycling.
In order to use these tools properly, you need a lot of data. Data about today’s traffic and a prediction of the traffic after the measure has been implemented. For these predictions you need traffic models. Till now only few models considered bicycle traffic at all. But, as mentioned in a previous article, FLOW works on this topic as well.
Challenges
Using these models and tools can be quite challenging because of the following three reasons: there is a lack of data, the sometimes unpredictable behaviour of cyclists and irrational decisions by decision makers.
Data
Without data or with the wrong data a model won’t give an adequate prediction. Data where people live, work or shop usually are generally available. Data on how many of the commuters take a bicycle, on the other hand, are not always available. Counting cyclists on the street and tracking their routes by apps can increasingly provide such data. The Netherlands is one of the forerunners, with yearly 50.000 people participating in the “Fietstelweek” (bicycle counting week). During this week, not only the relative number of cyclists on a certain road section are tracked, but also the speed and waiting time at intersections and the used routes between origin and destinations. Additionally, the Netherlands has very detailed information about the quality of every road section and crossing, collected by volunteers of the Fietsersbond for the “Fietsrouteplanner” or Cycle Route Planner. A combination of the “Fietstelweek” data and the “Fietsrouteplanner” information can give more insight on how cyclists choose their routes.
Unpredictable behaviour of cyclists
Traffic models have difficulties with modelling cyclists’ behaviour. How many cyclists take train, bus or car, in case of rain, wind or storm? The route choice of car drivers is predictable, but cyclists take different routes to get from A to B: some take the shortest route, others prefer a longer route to avoid traffic lights. Some will take a safer route or a more attractive route.
Cyclists and pedestrians behave differently as designed in micro model situations. Red traffic lights are often ignored, cyclists and pedestrians can move between congested cars or may even take a diagonal crossing if this seems safe enough. Cyclists and pedestrians can find their own way to deal with congestion. Result of this smart (but sometimes not legal) behaviour is that the capacity of a crossing is far bigger than might be expected. In these situations ‘common sense’ may be more useful than a traffic model.
Irrational decisions by decision makers
It seems logic to use traffic models and assessment tools before deciding about implementing a measure. But in practice models are often used after the decision, to reduce the uncertainty of the decision makers and to help politicians in selling the measure to the general public. The model should show ‘the good things’ with nice visuals to counterweight the usual negative comments of opponents.
This is not always wrong, as long as the used models and tools are accurate and transparent. The model shouldn’t just result in a number, but should clearly help to explain the choices, by giving a good analysis. It is important to be aware of misuse of models that are not transparent and use inaccurate data as the basis for the decision.
Models and assessment tools must stay in use
Does this mean we shouldn’t use models and assessment tools anymore? “No!” said the experts in the workshop. But models and assessment tools should always be use in combination with common sense and with caution for misuse. Models should always be transparent and are meant to help the discussions on relevant topics. There is still a challenge to make models more appropriate for pedestrians and cyclists, as they behave differently compared to cars. But there is progress in collecting relevant data and the understanding of the behaviour of cyclists and pedestrians by interpreting these data.
It is still worth a serious effort to assess the impact of traffic measures, as hundreds of millions of euros are spent in infrastructure projects.
Network/Project Involved:
Contact the author
Recent news!
Upcoming events
Contact Us
Avenue des Arts, 7-8
Postal address: Rue de la Charité, 22
1210 Brussels, Belgium


