Cycling and the Dutch: An ever-growing love affair
30 Oct, 2015
A new report by the Dutch Knowledge Institute of Mobility Management (KiM) gives an in-depth analysis about the status quo of the active transport modes – cycling and walking – in the Netherlands. The report title is very telling: ‘Cycling and Walking: the lubricating oil of our mobility’. Some figures about the state of the active modes first: Cycling and walking account for 47% of all trips made by the Dutch; they spend about 1/3 of their travel time on the active modes and cover about 1/10 of all km’s travelled by cycling and walking. In terms of modal split, only Switzerland fares better in the OECD world due to a very high mode share of walking, the report says. The Dutch are the uncontested leader in terms of cycling mode share (27%), but walk relatively less.
Trends
Both modes continued to grow in the Netherlands over the past 10 years (2004 - 2014): cycling +9% km, walking +13% km. About 1/3 of the increase in both modes can be explained by the growing population. But the Dutch also cycle longer distances: according to the national office for statistics CBS, every person covered in 2014 on average for the first time more than 1,000 km – 1,018 km to be precise.
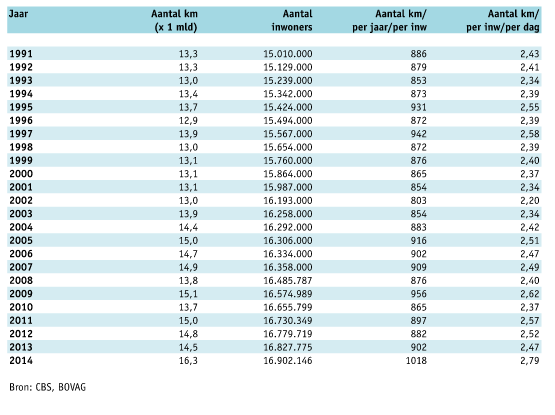 Year - No of km (in bn) - Population - No of km/ year/ inhabitant - No of km/ inhabitant/ day
The KiM report discusses a number of socio-economic characteristics that all impact the use of cycling, including age, sex, income, size of household, ethnic background, and confession. Most of the findings are to be expected, such as that of all age groups it’s the 12 – 17 year old who cycle most. An interesting fait divers is that protestant pedal more than catholic while the opposite is true for walking. Nor does it come as a surprise that the ongoing urbanization is found to contribute to an increase in cycling: over the past 20 years, the share of the urban population grew from 39 to 48 %, and it is here that the volume of cycling increased by 22 %. At the same time, the rural population shrank from 39 to 32 %, and cycling decreased by 9%.
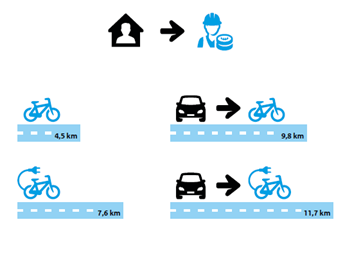 Average home-work distance for cyclists (left) and for cyclists who exchanged the car for the bike for commuting purposes (right) Source: Fietsberaad
E-Mobility
The success of electric assisted bicycles makes a major contribution to the growth in cycling in the Netherlands. In 2014, about 1 in 5 bicycles sold was an electric assisted bicycled; they account for 12 % of all km cycled. The average trip length is 5.6 km, or about 1.5 times longer than on a regular bike. For home-to-work commutes, people are willing to cover longer distances than for all trip purposes combined. On a regular bike, the average distance covered is 4.5 km, on an electric assisted bike 7.6 km. Commuters who exchanged their car for a regular bike, cycled on average 9.8 km and 11.7 km on an electric assisted bicycle. Most Dutch are prepared to e-cycle as much as 15 km to work (7.5 km on a regular bike).
Modal shift potential
The KiM report does not make any quantitative assumptions about how many trips could be potentially shifted to cycling. However it concluded that the electric assisted bicycle – by extending the range that can be covered – is not just a new type of bicycle but that it considerably alters the mobility options of the users. A different study (Nederland Fietsland, Artgineering, in opdracht van het College van Rijksadviseurs) calculated the cycling potential for commuting, also based on the assumption that 15 km is a realistic cycling range. 61% of the Dutch employees lives within a distance of 15 km from their workplace, 25 % of the workforce uses the bicycle already for this purpose. Cycling hence still has a potential of 36 % percentage points in the modal split for commuting distances up to 15 km.
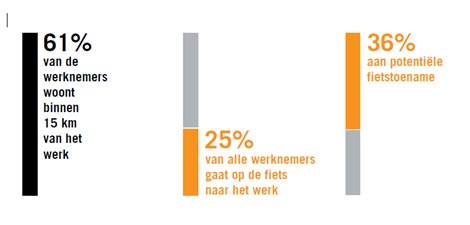 61% of the employees lives within 15 km of workplace - 25% of all employees cycles to work - 36% potential bike increase
Intermodality
Another mobility option which is extremely popular in the Netherlands is the combination bike + train. A stunning 50% of all train users cycles to the railway station. The Dutch bicycle parking facilities at railway stations, which are second to none certainly in Europe, are a relevant pre-condition for this success. Since 1999, about 300,000 bicycle parking places were added at almost 400 railway station across the nation. Read more.
Success factors
Why is cycling such a tremendous success in the Netherlands? The report says that surprisingly relatively little is known about the success factors simply due to a lack of good ex-post evaluation of measures. However, it cites a recent study by Harms and Bertolini (2015) who identifies a good mix of hard, - soft and orgware measures as success factors, including:
- Make cycle use more attractive by better infrastructure in terms of quantity and quality (hardware pull measure)
- Introduce disincentives for car use, e.g. by a more restrictive car parking management (hardware push measure)
- A good organization and implementation of policy, such as the setting of measurable objectives, the stimulation of citizen participation, the possibility to experiment with solutions (orgware)
- Marketing, communication and education, such as mobility education for children (software)
- Take into account specific socio-economic and spatial differentiation characteristics of regions, towns and cities, and neighborhoods.
Things to improve
The report refers to a number of studies/ articles that have calculated the economic benefit of cycling, including ECF’s 2013 report about the economic benefit of cycling in the EU-27. However, the report deplores that cost-benefit analyses (CBA) for cycling infrastructure projects are not as developed as for motorized modes and therefore have been rarely applied until now.
The role of the national level
The authors mention that since 2007, local and regional authorities are responsible for transport and mobility policies, including cycling. However, this does not mean that the national government has completely withdrawn itself from cycling policies. The reports lists 4 examples of national level involvement, including the collection of better data on cycle use, the provision of funds for building cycle infrastructure through national congestion-easing programs (‘Beter Benutten’), or the funding of bike parking facilities at railway station. There are some initiatives such as the ‘Tour de Force’ who discuss how all levels of government can play a role in further promoting cycling.
Is the Netherlands the bike country par excellence?
The report finishes by referring to the ECF Cycling Barometer that put the Netherlands in the 2015 edition at 2nd place, behind Denmark, after both countries had shared the pole position in the 2013 edition. ECF trusts that the Netherlands will fight back to reconquer place no 1, just in time for the 3rd edition to be likely published for the Velo-city 2017 in Arnhem-Nijmegen (NL). The EU Presidency of the Netherlands in the 1st half of 2016 will be the perfect next occasion to show to the rest of Europe why the Dutch are in love with the bicycle.
Sources Kennisinstituut voor Mobileitsbeheer (Ministerie van Infrastructuur en Milieu), Fietsen en Lopen: de smeerolie van onze mobiliteit. Oktober 2015. http://www.kimnet.nl/sites/kimnet.nl/files/fietsen-en-lopen_de-smeerolie-van-onze-mobiliteit.pdf Harms, L., L.Bertolini, et.al (2015), Performance of Municipal Cycling Policies in Medium-Sized Cities in the Netherlands since 2000. Transport reviews (ahead-of-print): 1-29.
Regions:
Topics:
- Log in to post comments
Related content

Jill Warren’s Top 10 session picks for Velo-city 2024
With Velo-city 2024, the annual flagship event of the European Cyclists’ Federation (ECF), just days away, it is time to start planning your conference experience. Jill Warren, CEO of ECF, shares her must-attend session tips for this year in Ghent.
Ellis Mourits
06 Jun, 2024

Yvan Verougstraete: We need to have cycling in all politics
ECF interviewed the top candidate on the European list for Les Engagés, a Belgian political party that is part of the EPP political group, explaining why he endorses ECF’s #VoteBikeEU campaign.
Philip Amaral
30 May, 2024

Can road markings support the development of cycling?
Eyes on the road! A study by RISE Research Institutes of Sweden[1] measured cyclists' visual distribution of attention by eye tracking when cycling through central Stockholm. Most cyclists' attention is directed towards the surface in good...
Aleksander Buczynski
29 May, 2024
Contact the author

Recent news!


Upcoming events
Contact Us
Avenue des Arts, 7-8
Postal address: Rue de la Charité, 22
1210 Brussels, Belgium
Phone: +32 2 329 03 80
Email: office@ecf.com